If surveys.csv, species.csv, and plots.csv are not available in your workspace download them:
Load them into R using read.csv().
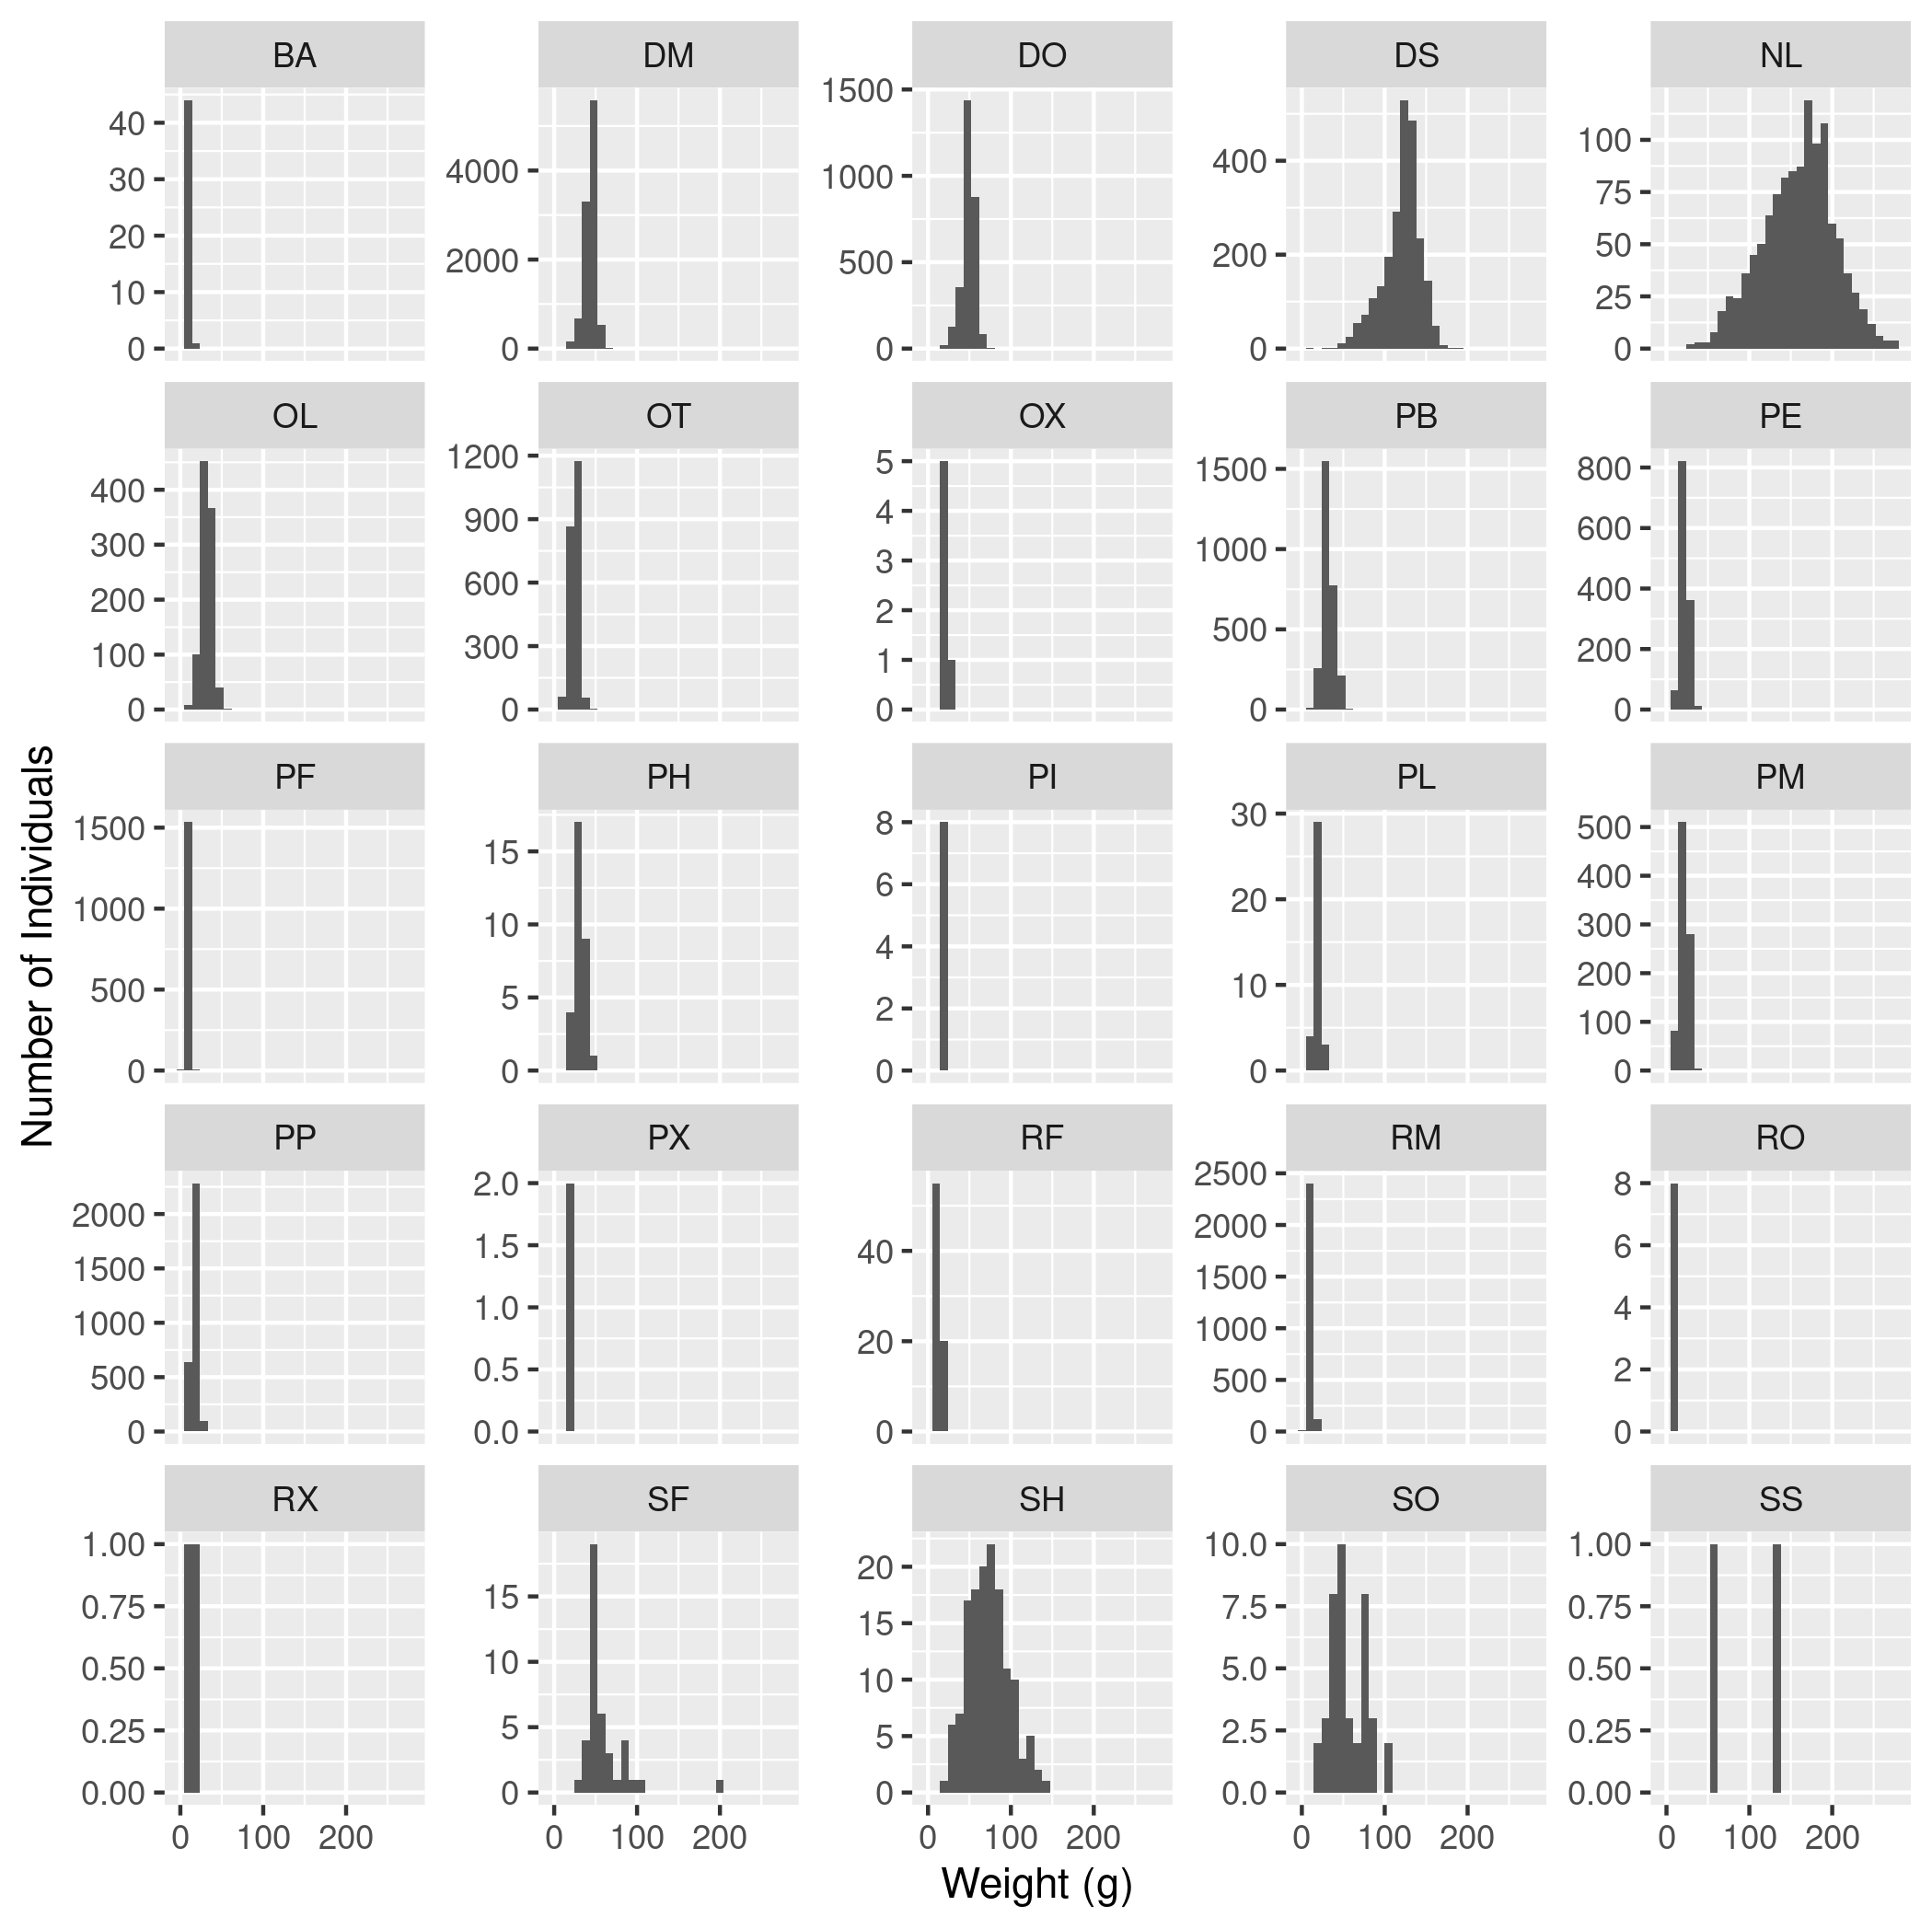
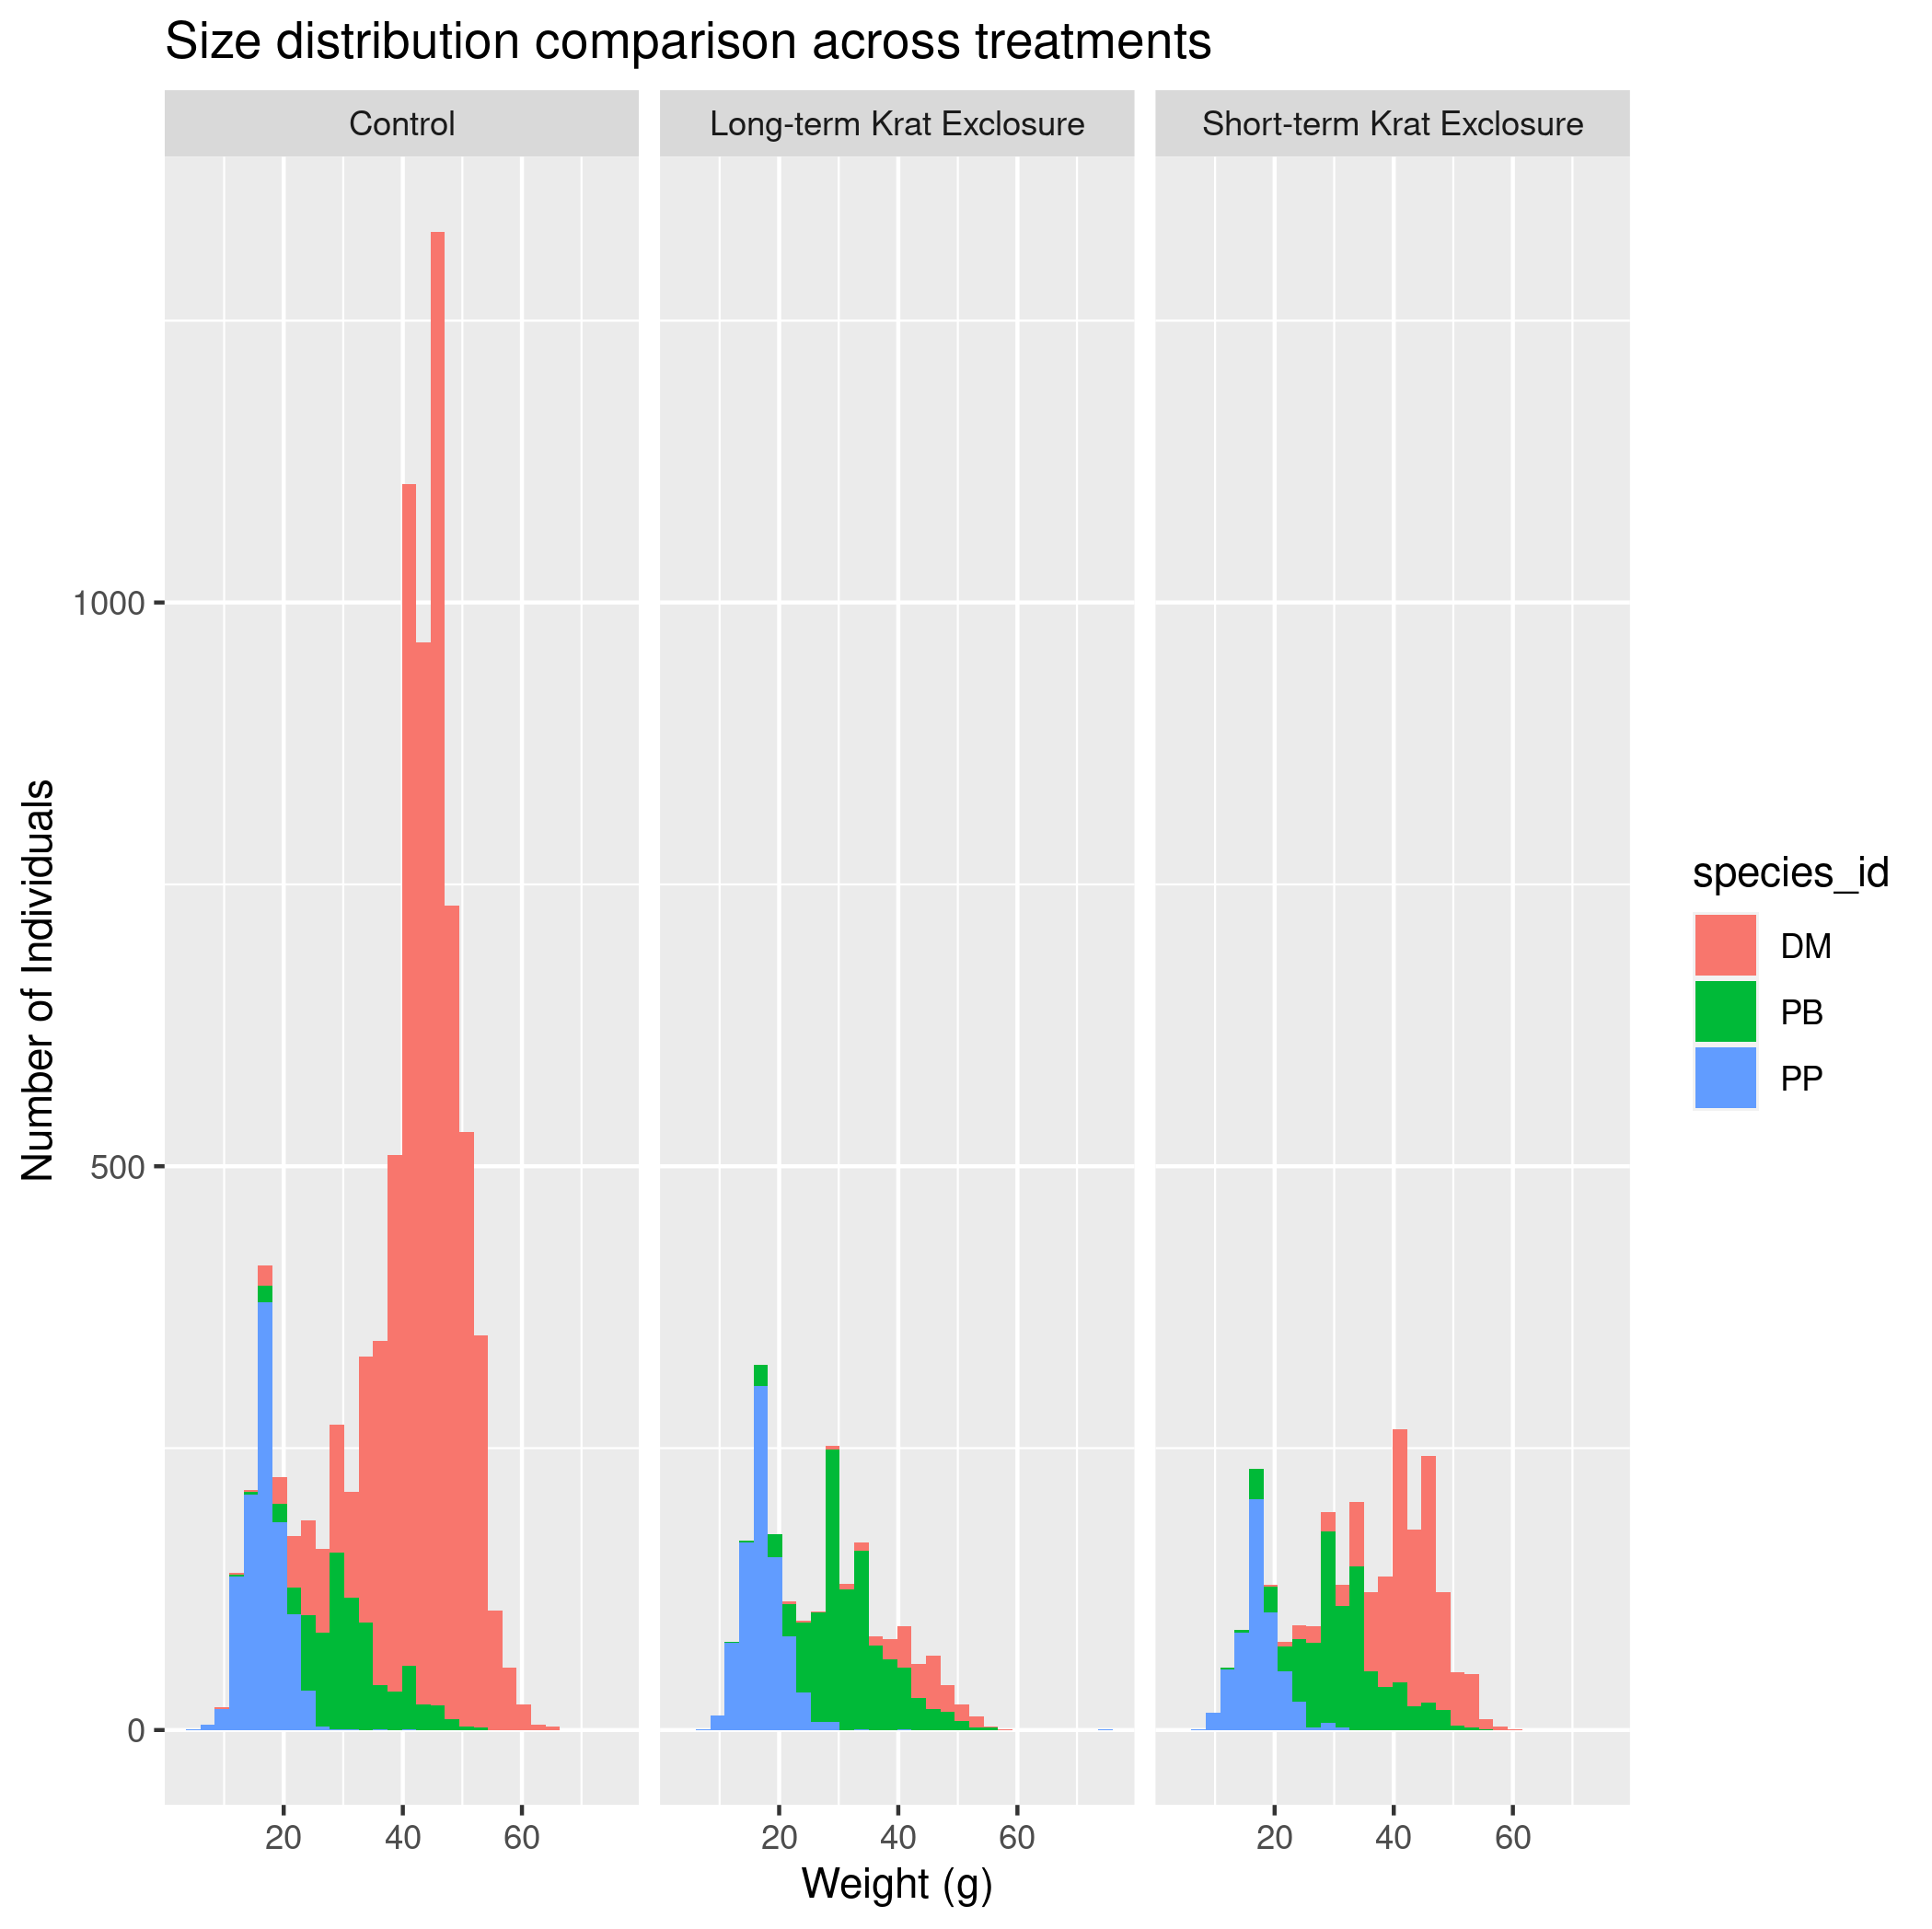
species_id DO, with the columns year, month, day, species_id, and weight.PP and PB and for years starting in 1995, with the columns year, species_id, and hindfoot_length, with no null values for hindfoot_length.hindfoot_length for each species_id in each year with no null values.year, genus, species, weight and plot_type for all cases where the genus is "Dipodomys".weight on the x-axis and hindfoot_length on the y-axis. Use a log10 scale on the x-axis. Color the points by species_id. Include good axis labels.species_id. Do not include species with no weights. Set the scales argument to "free_y" so that the y-axes can vary. Include good axis labels.PP, PB, and DM, colored by species_id, with a different facet (i.e., subplot) for each of three plot_type’s Control, Long-term Krat Exclosure, and Short-term Krat Exclosure. Include good axis labels and a title for the plot. Export the plot to a png file.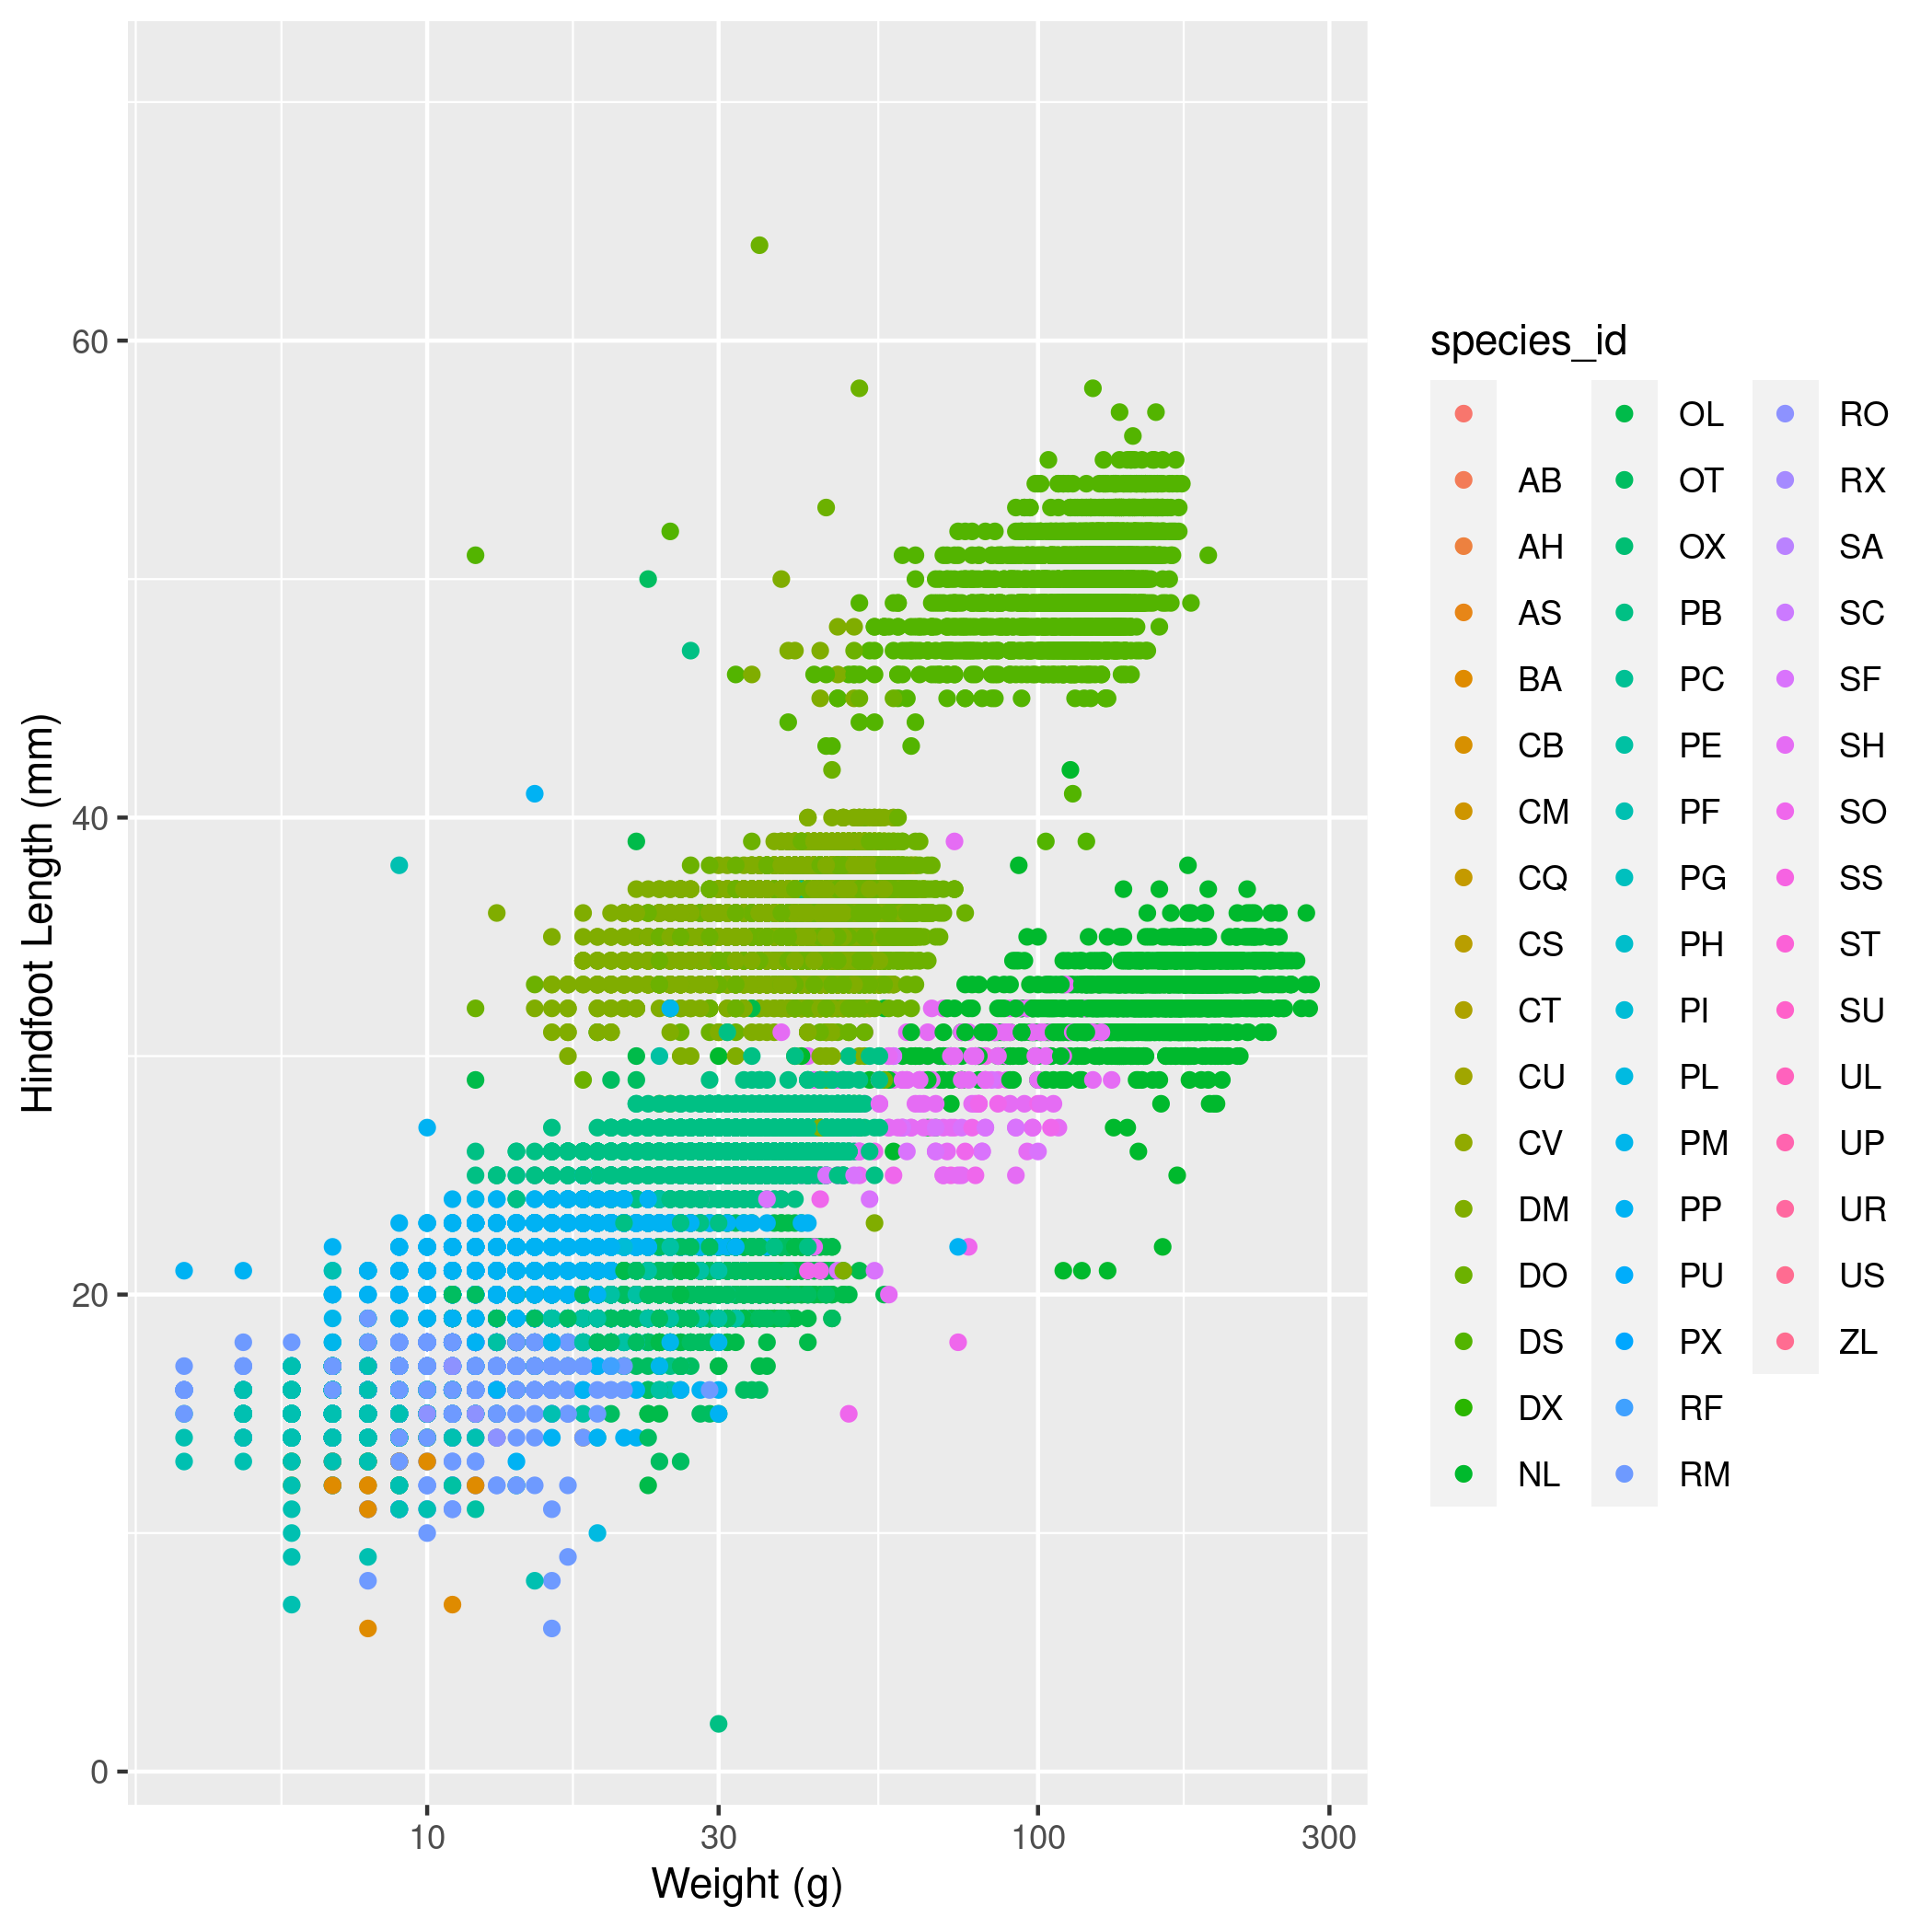