The National Ecological Observatory Network has invested in high-resolution airborne imaging of their field sites. Elevation models generated from LiDAR can be used to map the topography and vegetation structure at the sites.
Check to see if there is a data directory in your workspace with HARV subdirectory in it.
If not, Download the data and extract it into your working directory.
The HARV directory contains spatial data for Harvard Forest including raster data for a digital terrain model (HARV_dtmFull.tif) and a digital surface model (HARV_dsmFull.tif), and polygon data for the site boundary (harv_boundary.shp) and the soil types (harv_soils.shp).
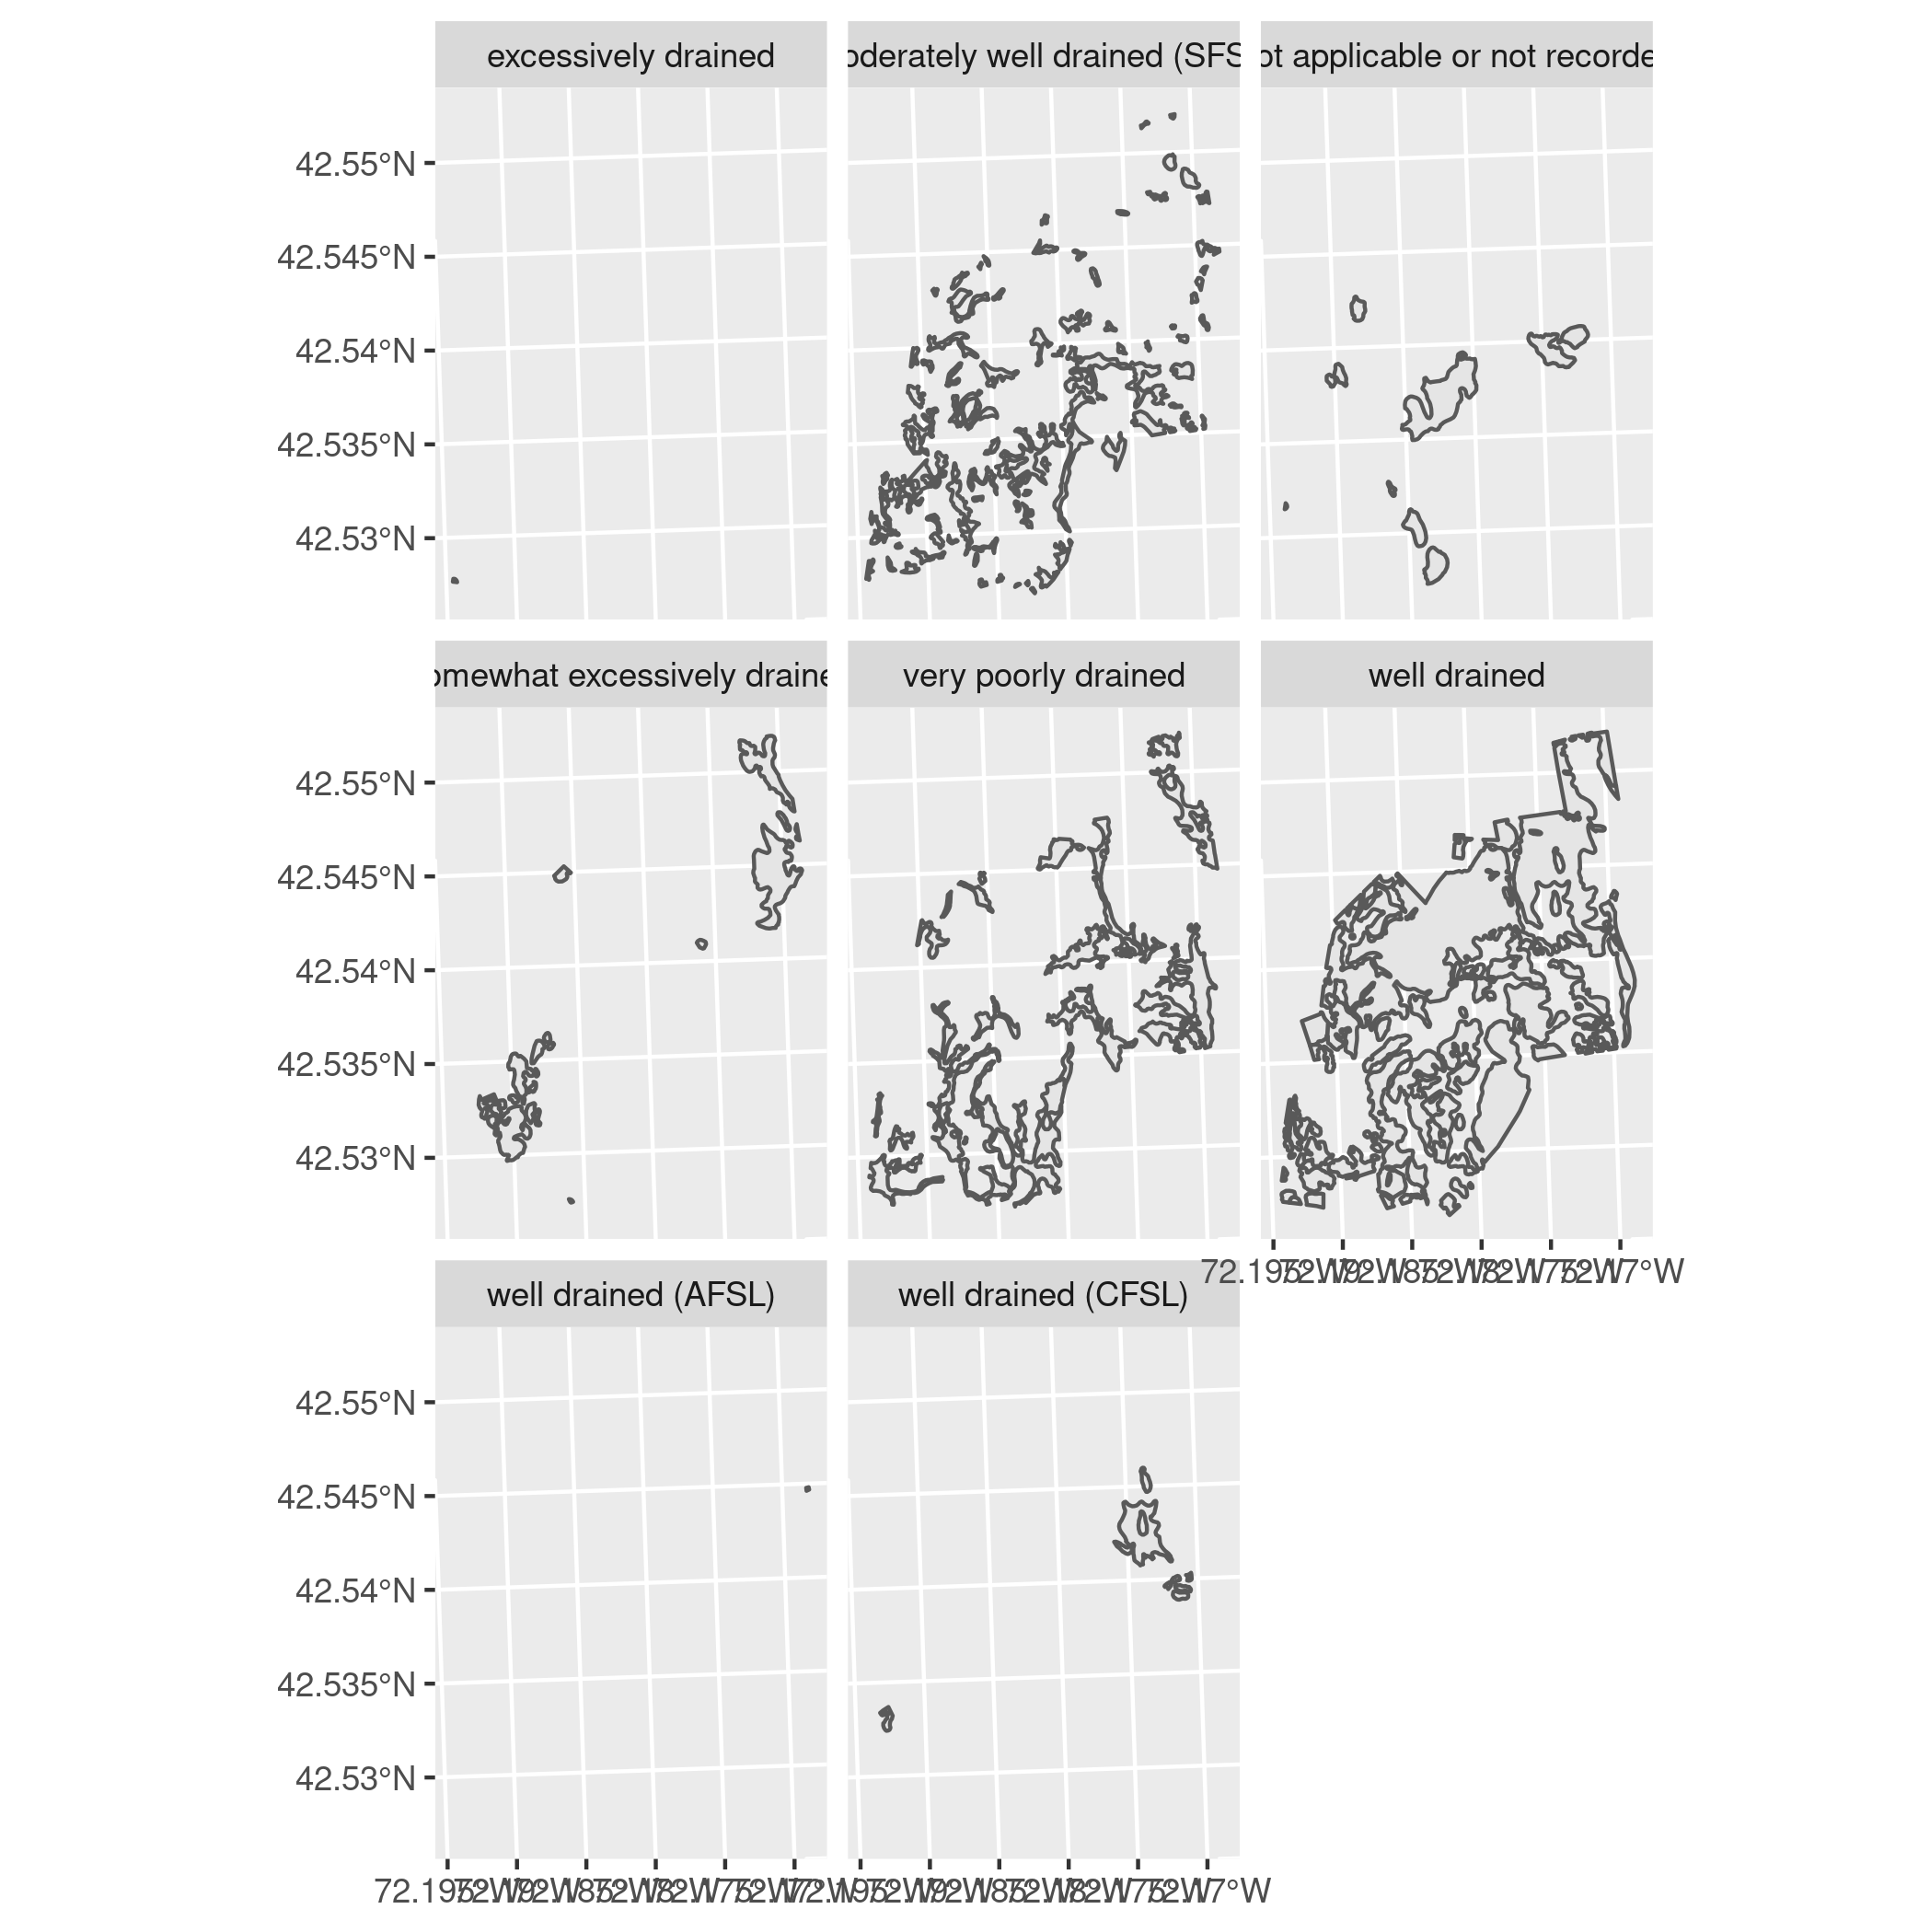
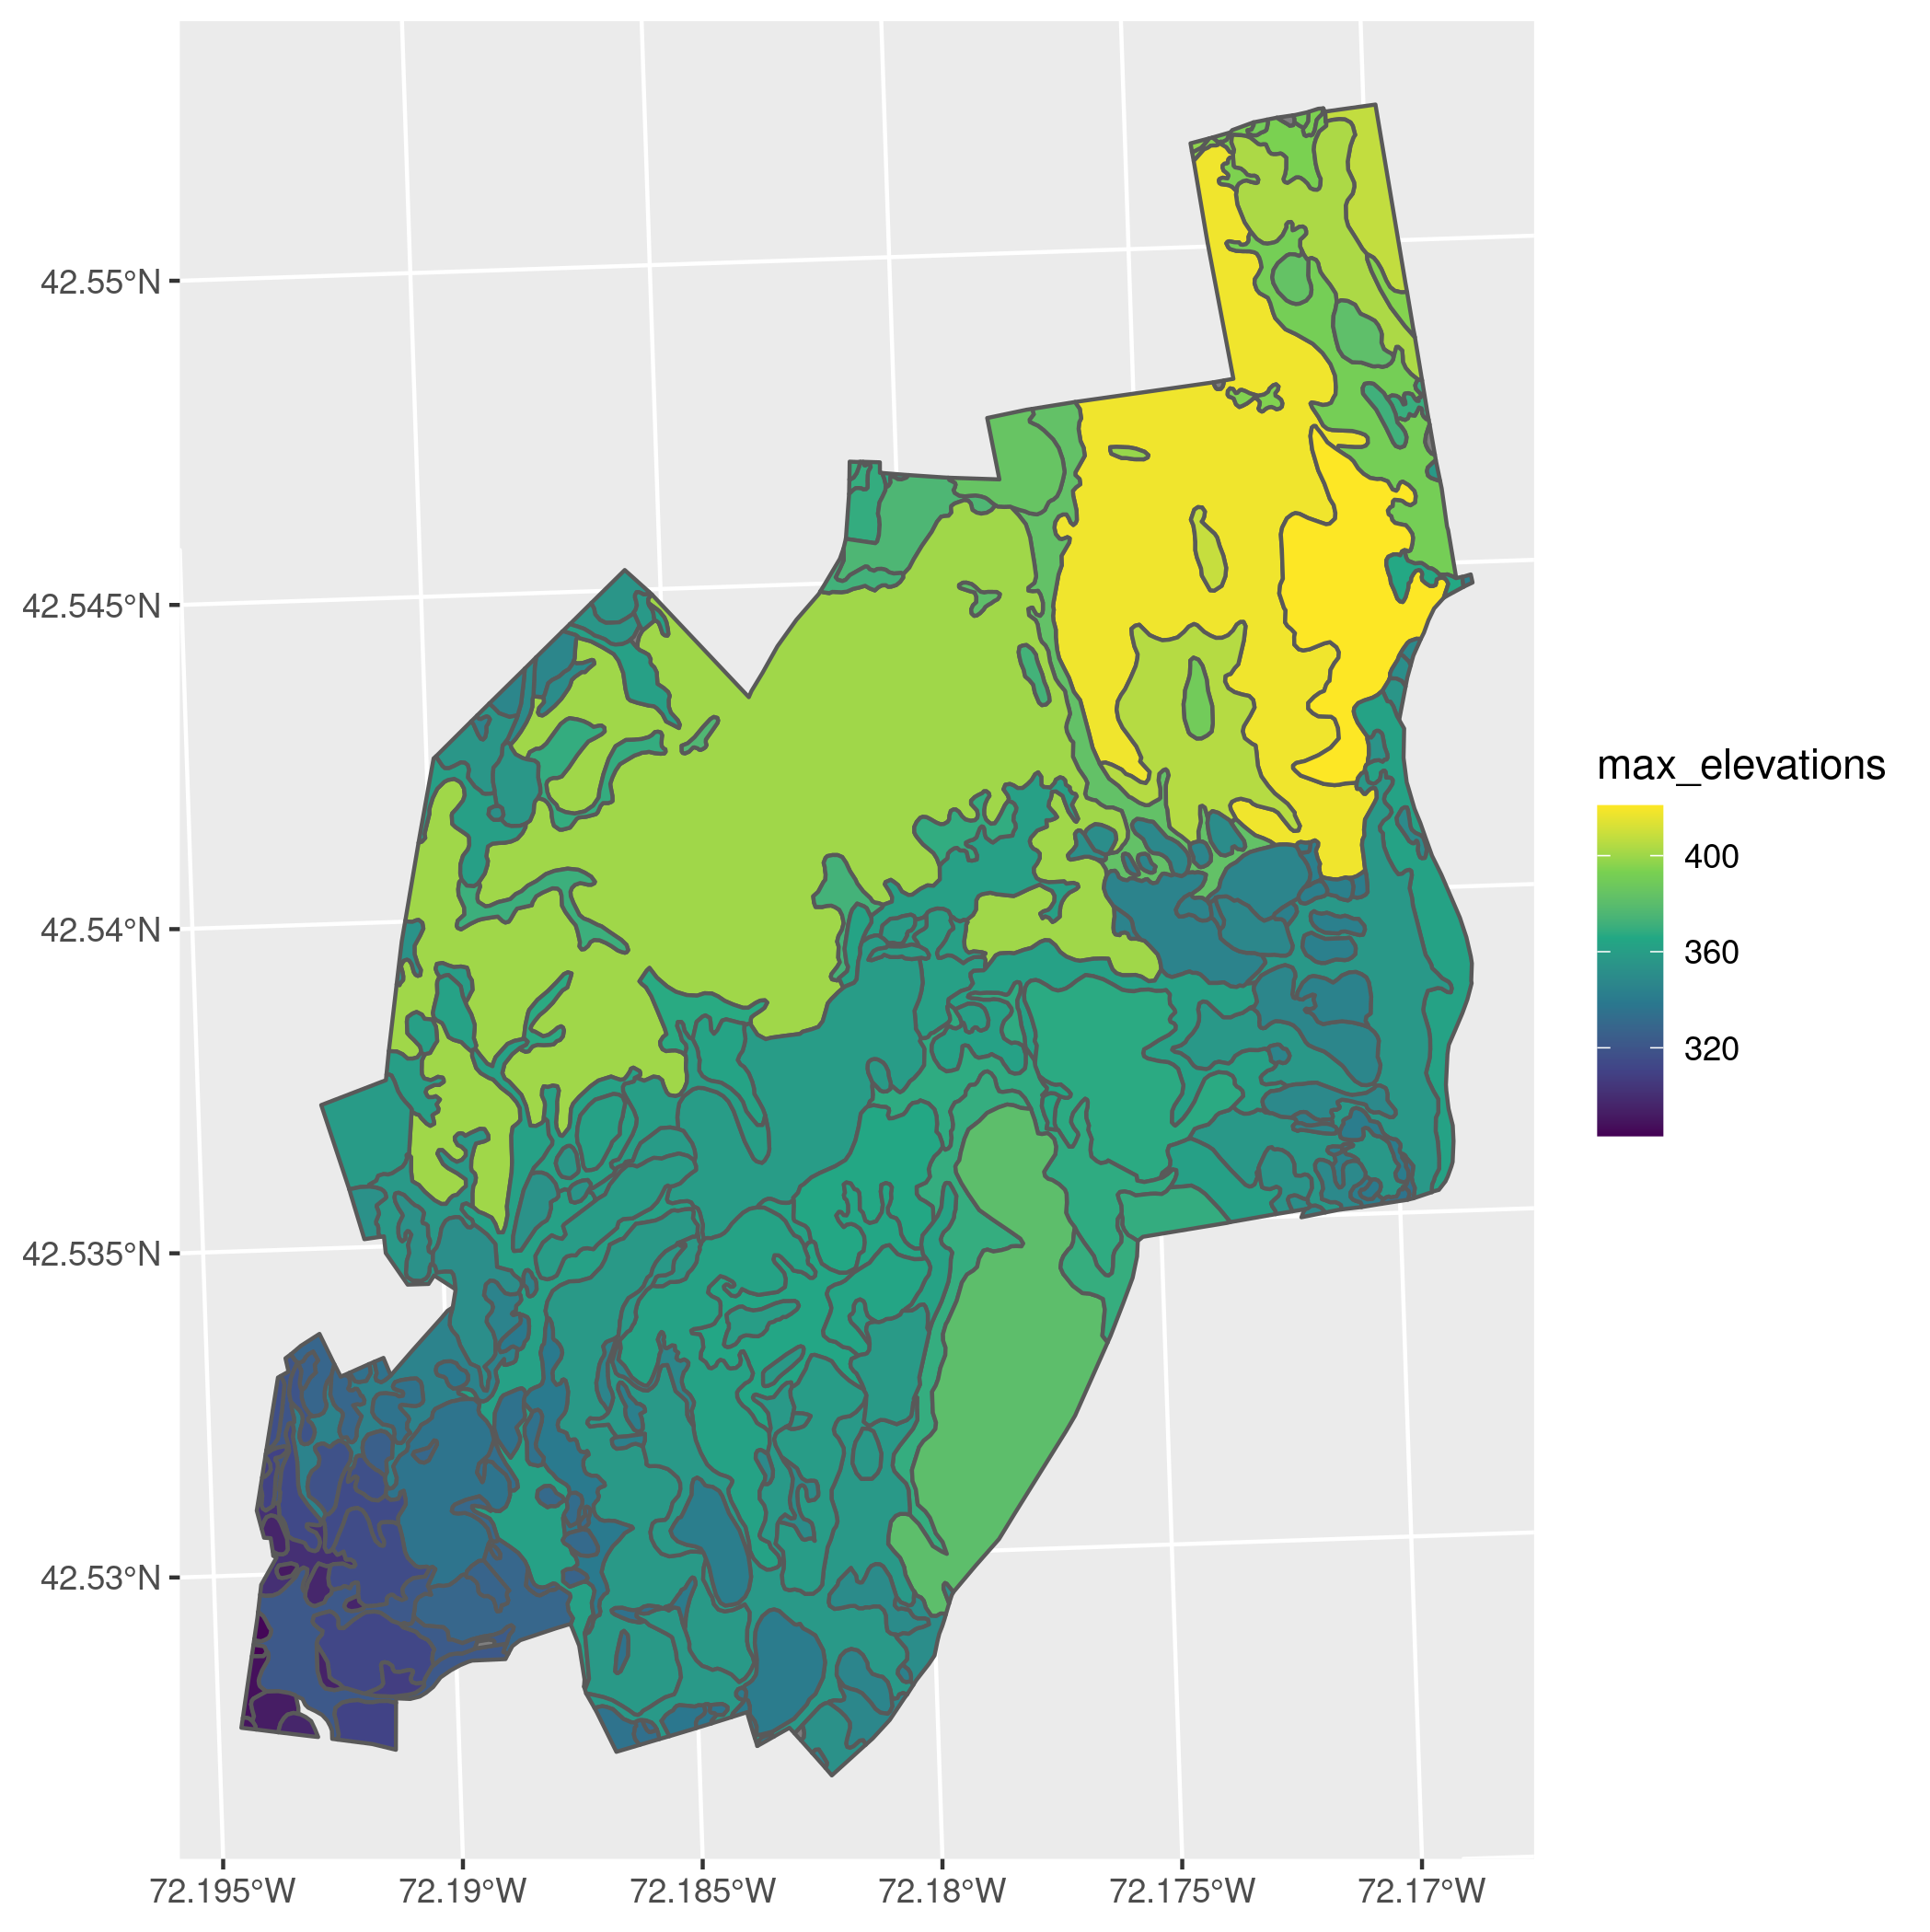
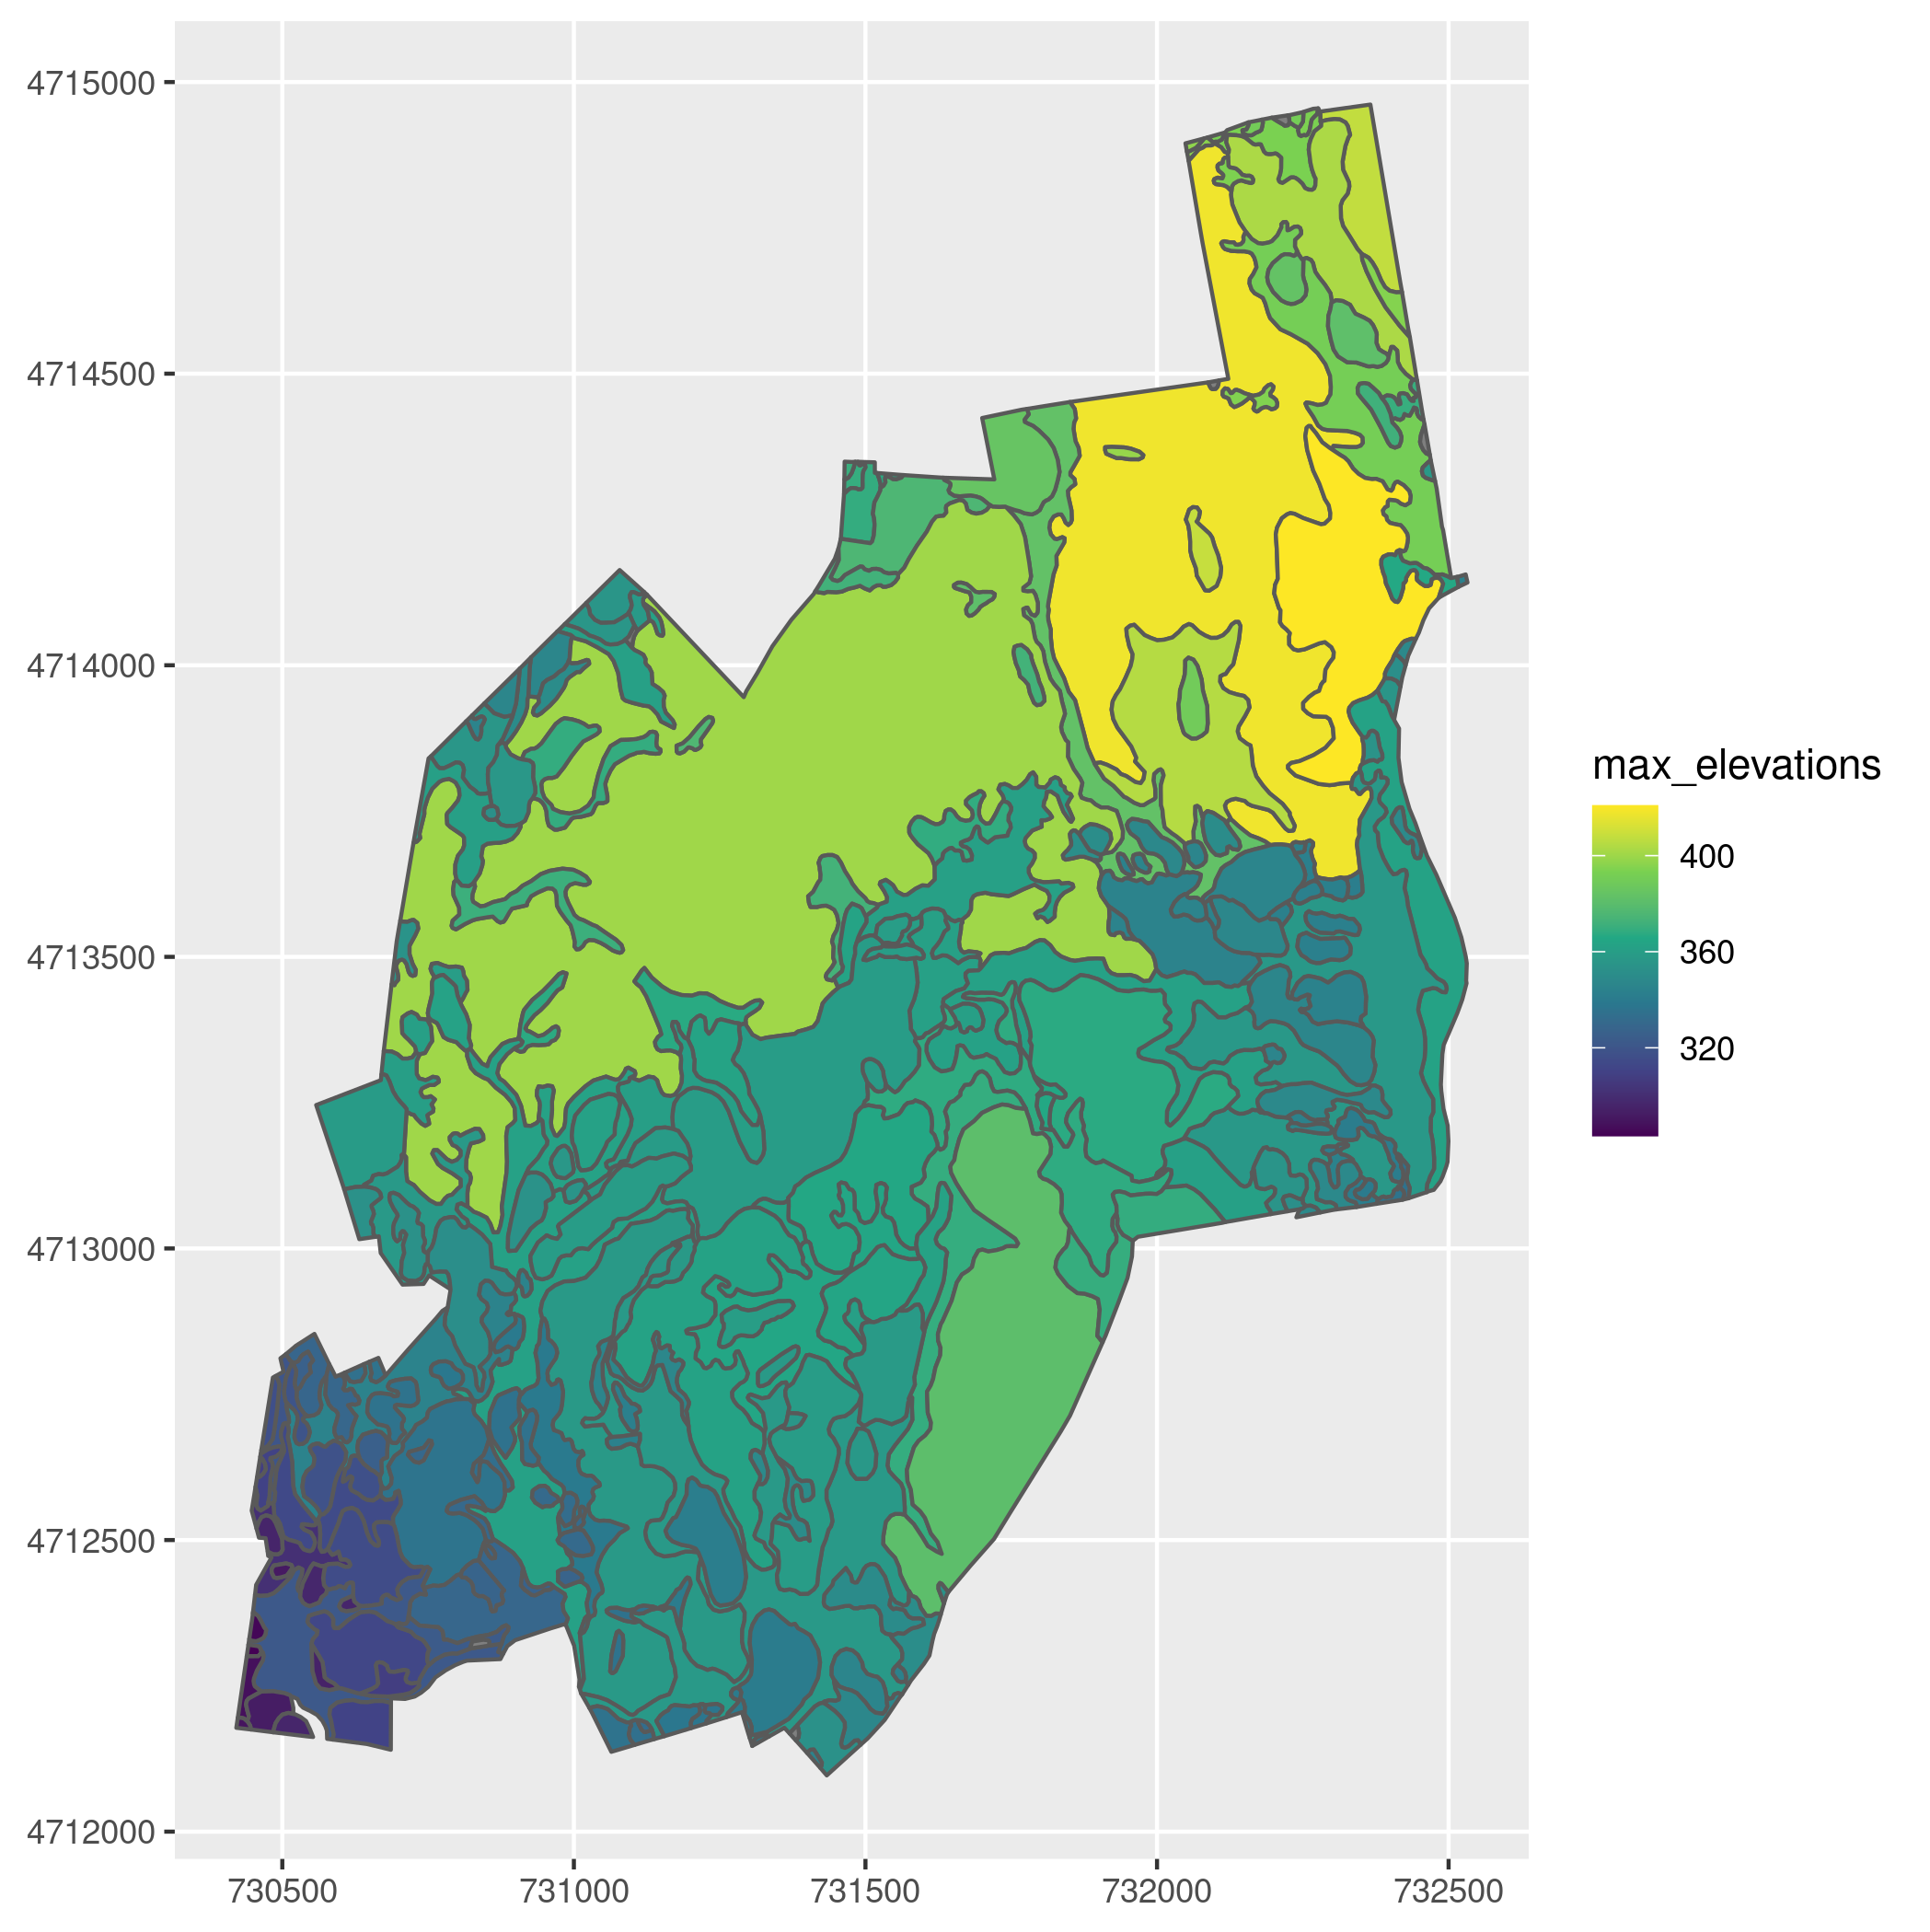
harv_soils data with the polygons colored based on DRAINAGE_C column. Use the viridis color ramp.harv_soils data with one facet (i.e., subplot) for each category in the DRAINAGE_C column.HARV_dtmFull.tif data extract the maximum elevation (i.e., the DTM value) within each soils polygon. To get the maximum elevation instead of the mean value use the max function instead of mean. Display a vector of the resulting elevations.sf object and display the resulting data frame.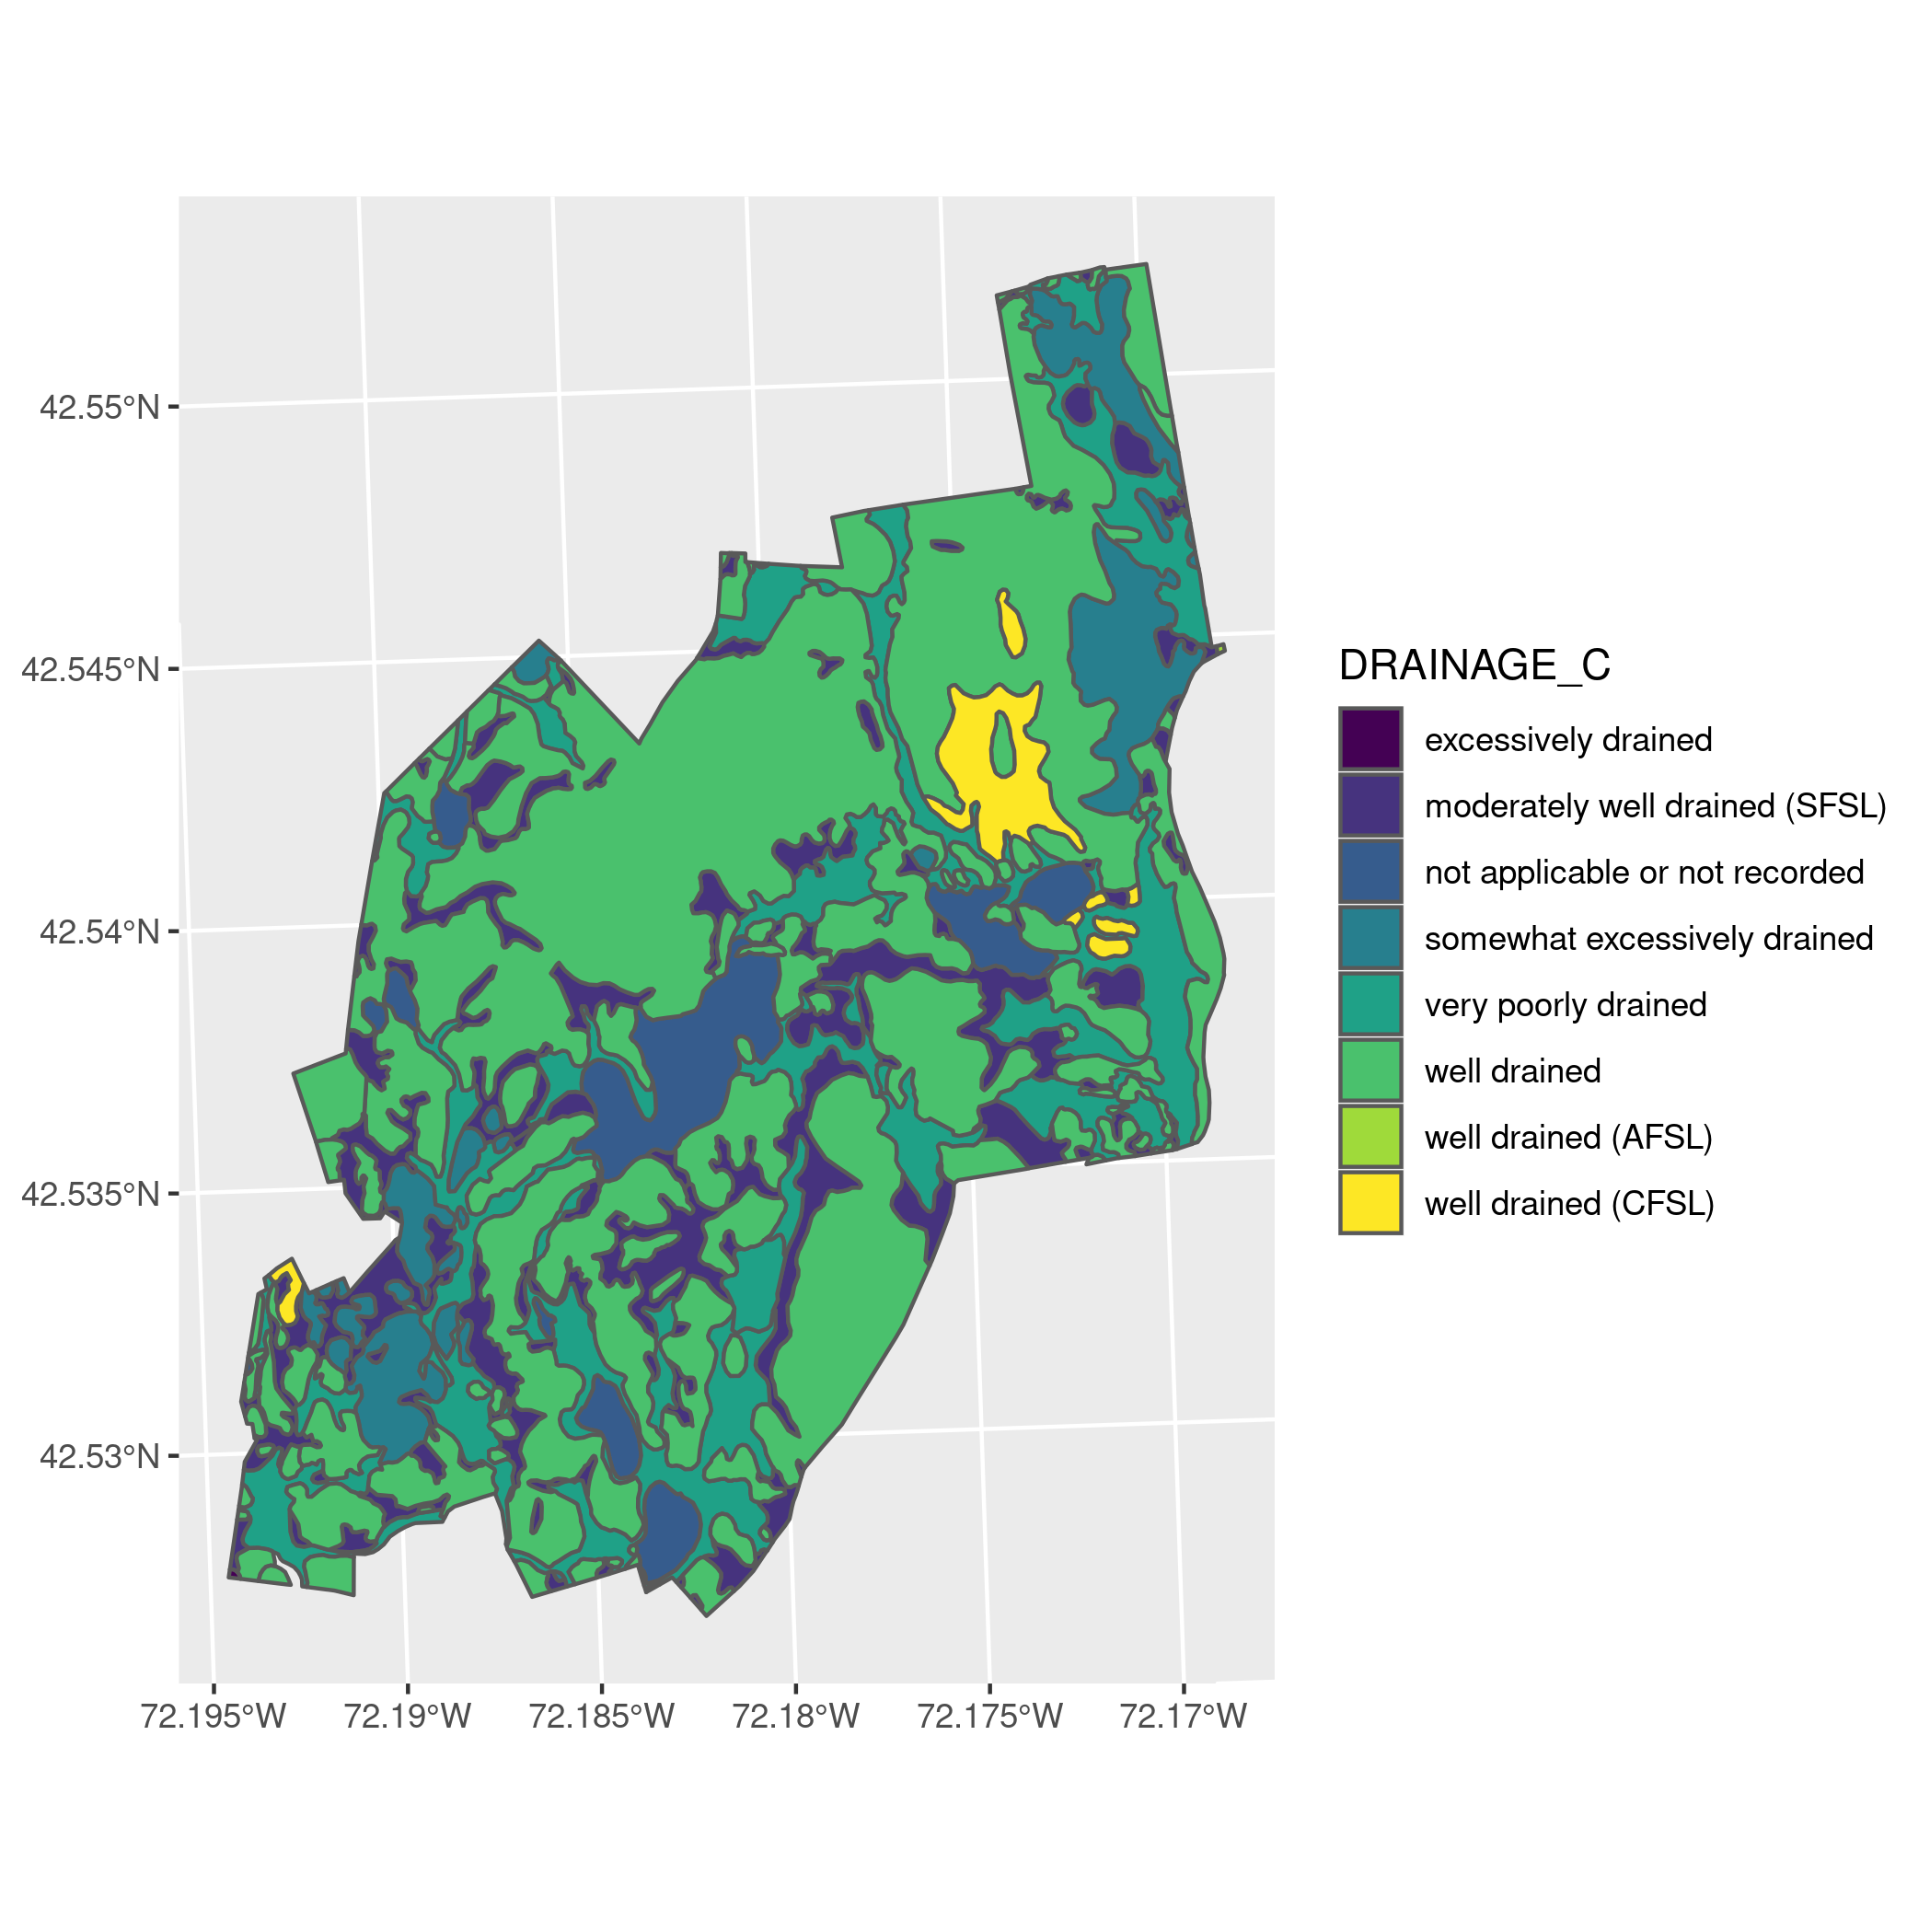