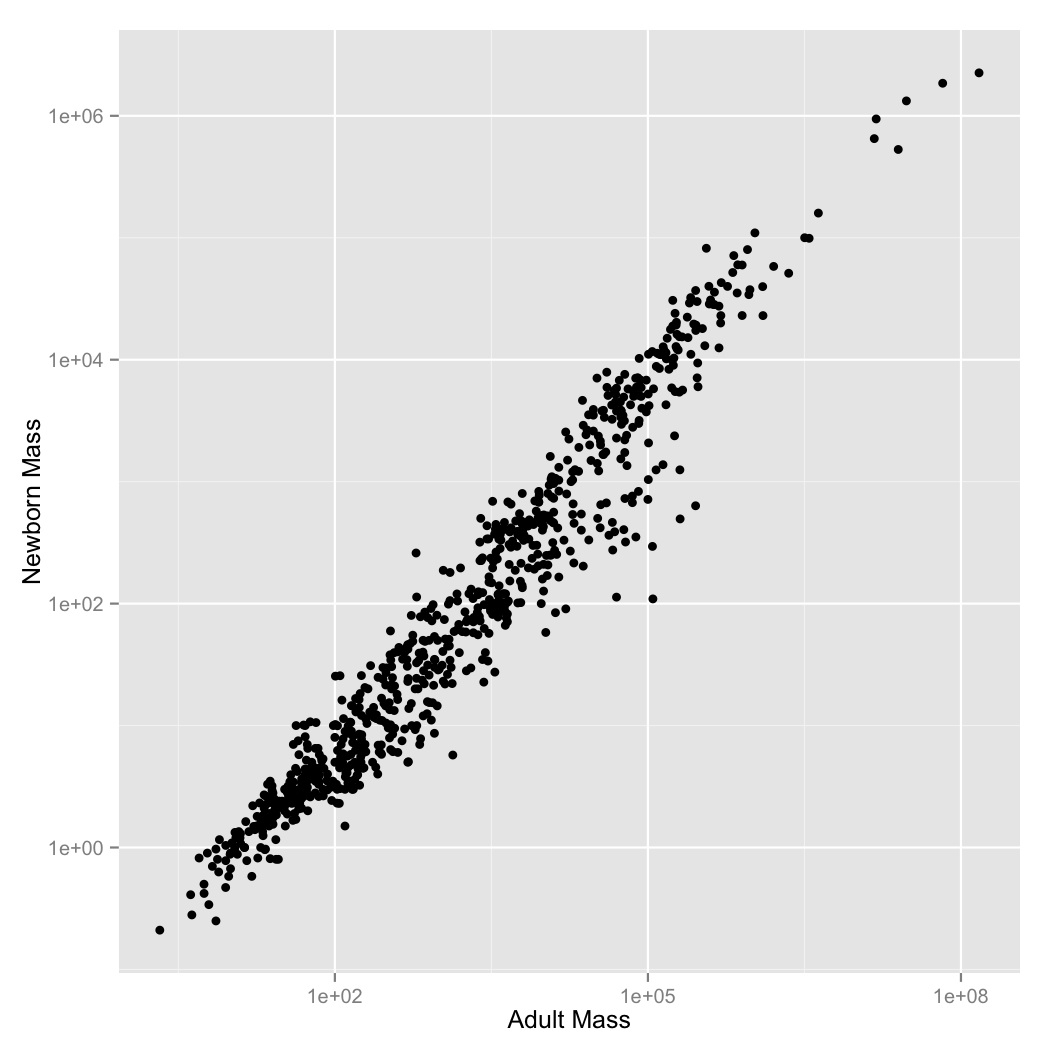
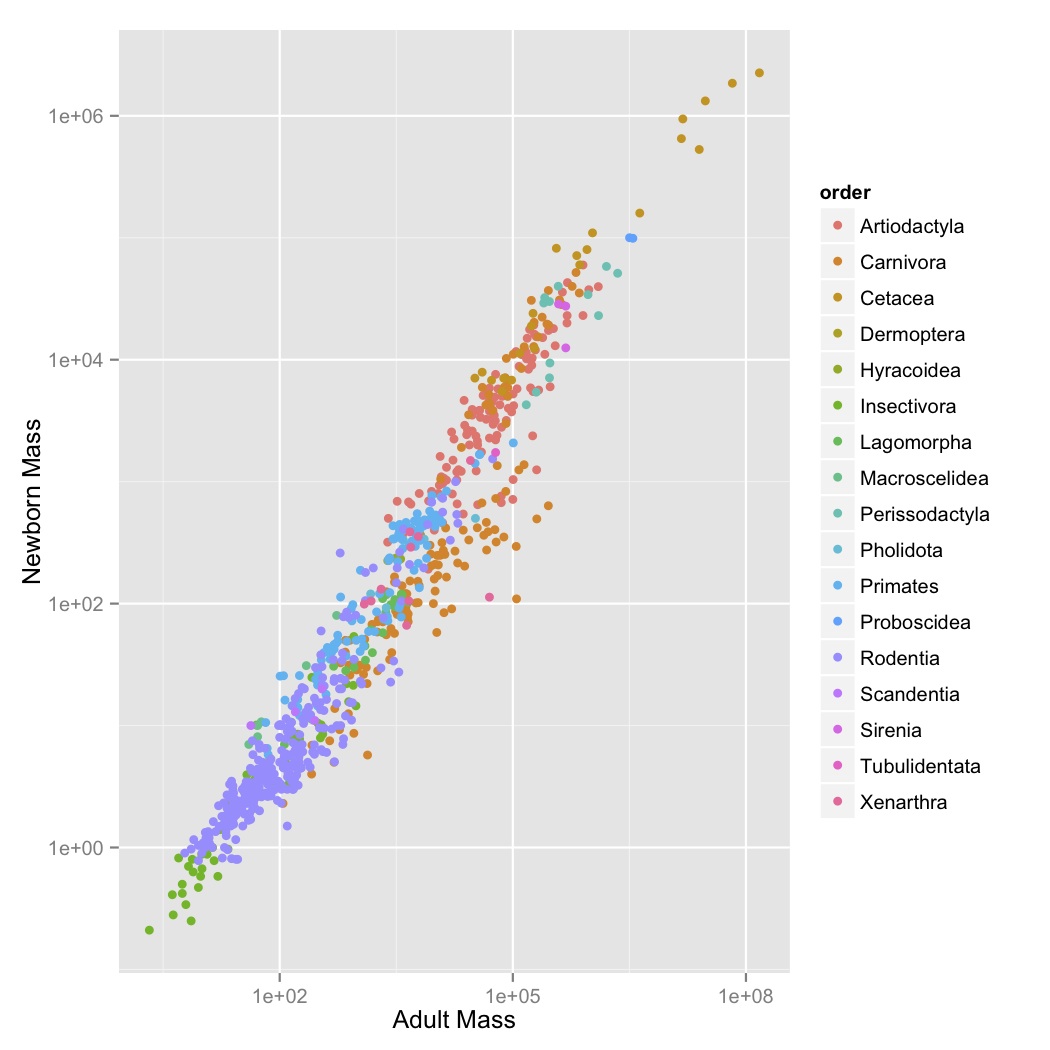
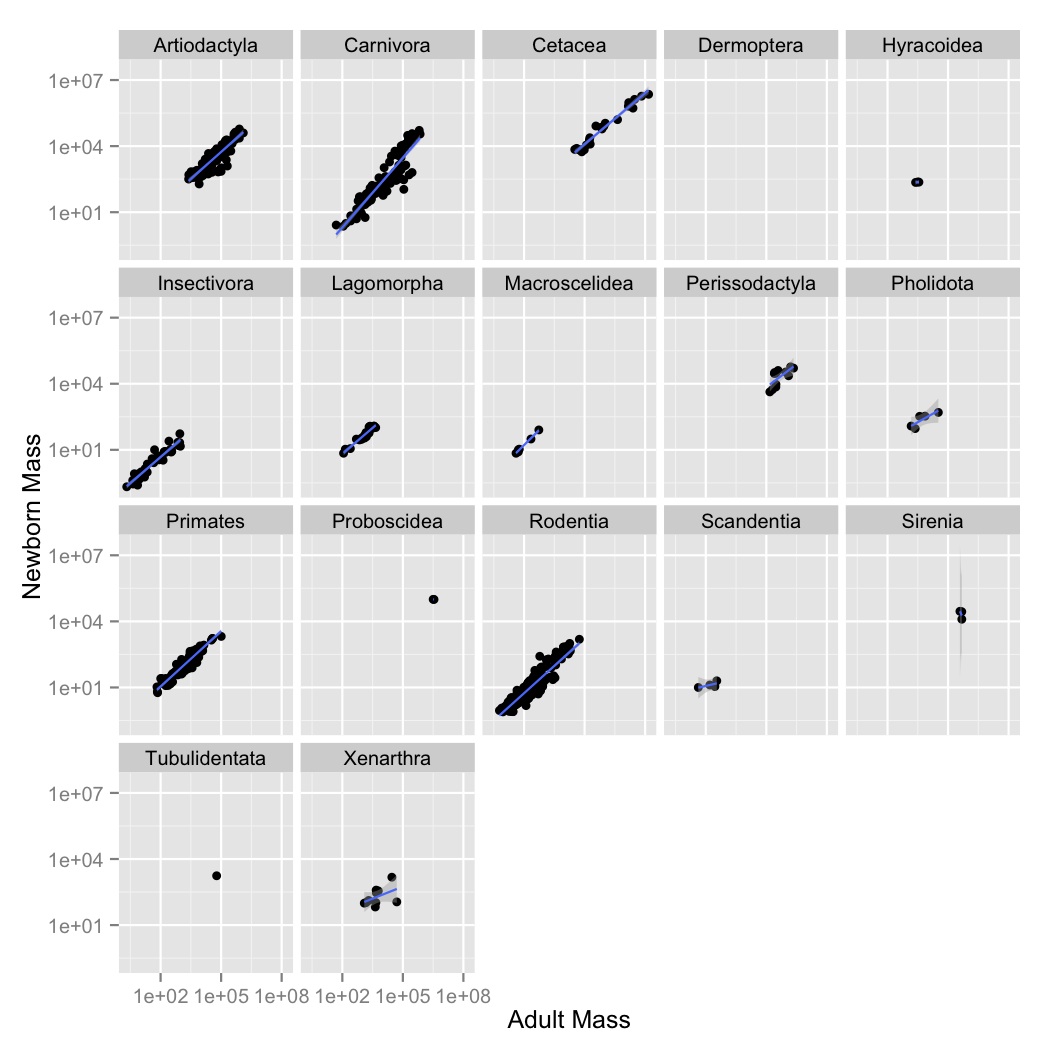
Larger organisms have larger offspring. We want to explore the form of this relationship in mammals.
Check to see if Mammal_lifehistories_v2.txt is in your working directory.
If not download it
from the web.
This is tab delimited data, so you’ll want to
use sep = "\t" as an optional argument when calling read.csv(). The \t is
how we indicate a tab character to R (and most other programming languages).
When you import the data there are some extra blank lines at
the end of this file. Get rid of them by using the optional read.csv()
argument nrows = 1440 to import only the first 1440 rows.
Missing data in this file is specified by -999 and -999.00. Tell R that
these are null values using the optional read.csv() argument,
na.strings = c("-999", "-999.00"). This will stop them from being plotted.
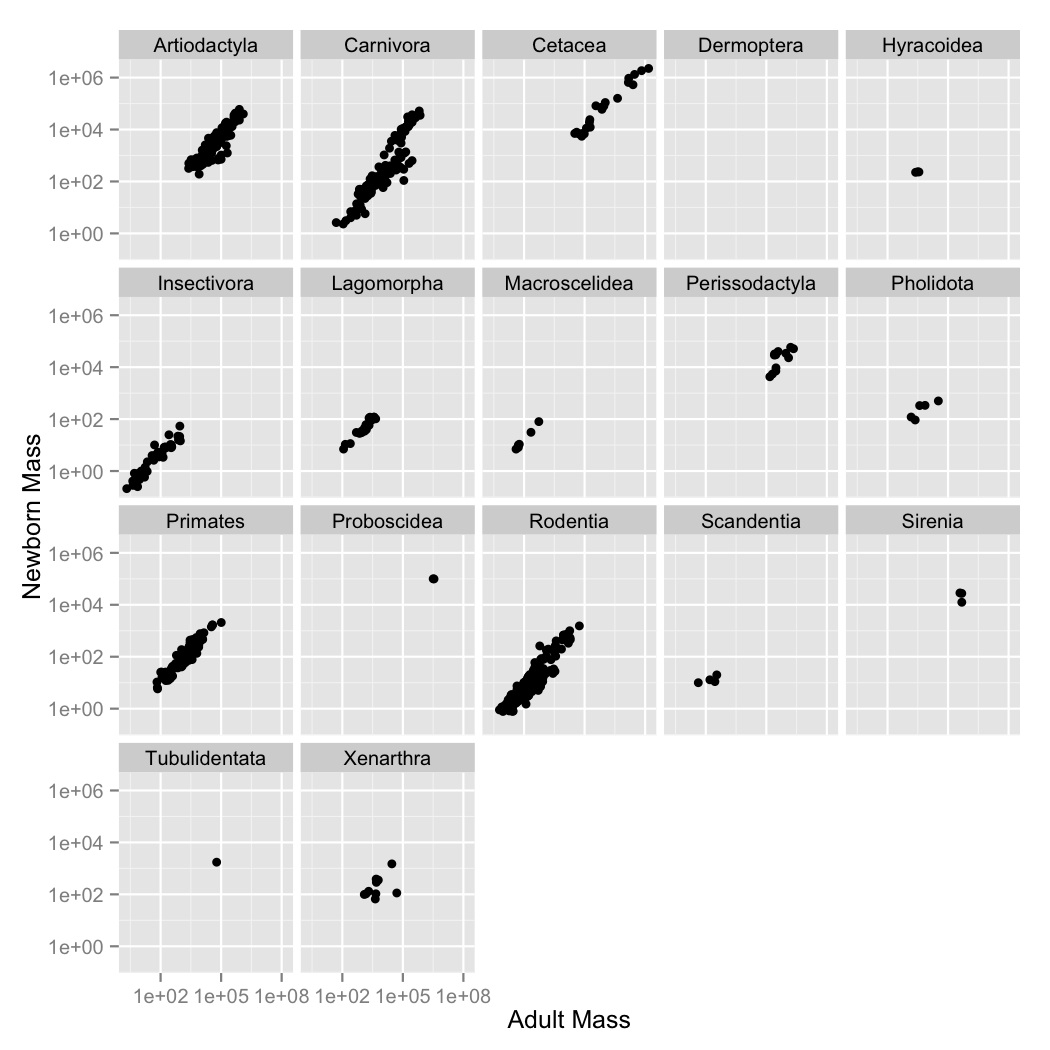
facet_wrap to
create a subplot for each order.geom_smooth to fit a linear model to each order. You can do this using the
optional argument method = "lm" in geom_smooth.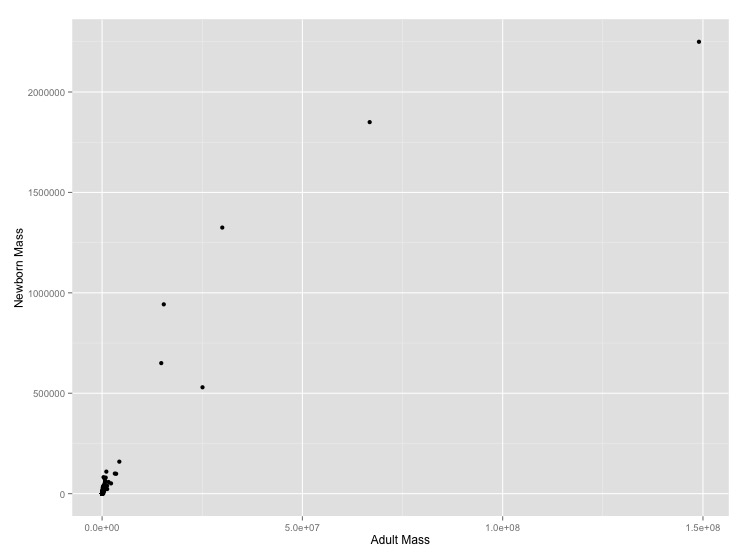